As a reference for myself, and for anyone else who might be interested, I'm going to collect all the vital information I need to get such forecasts on this web page. I will update it as I uncover more useful nuggets of information.
METAREAS
The world's oceans are divided up into Metareas, with different countries having primary responsibility for providing forecasts for each area. We are interested in Metareas IV (western Atlantic) and II (Eastern Atlantic)
METAREAS
The world's oceans are divided up into Metareas, with different countries having primary responsibility for providing forecasts for each area. We are interested in Metareas IV (western Atlantic) and II (Eastern Atlantic)
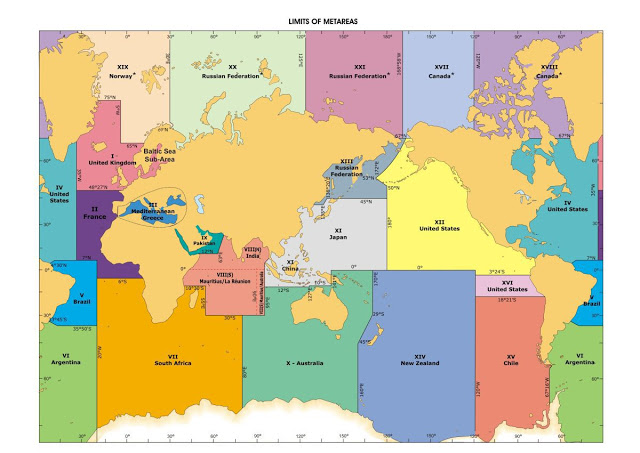 |
| Metareas |
WEATHER CHARTS
Weather charts are created by weather service professionals who analyze raw data (like that contained in GRIB files) and use their vast experience to produce charts which represent their best forecast of the weather. They also explain their forecasts in the high seas text forecasts, described below.
National Weather Service (NWS): The NWS has the most comprehensive set of weather charts for the whole North Atlantic.
- OPC Web page
- NWS FTP directory
- Index page of NWS FTP directory
- Starpath Index
- MailASail Index
- Worldwide Radiofax Schedule
To obtain NWS charts by email, send an email like this:
To: query@saildocs.com
Subj: any
Body:
send filename (example PYAA12.TIF)
- or -
sub filename time=06:00 days=5
An easy way to compose these emails is to use the Starpath or MailASail Index which allows you to click on an email link for a particular chart, which creates the email for you. It is possible to request several charts with one email. Both indexes provide reduced-size charts that are roughly half the size of the full-size versions (18kb compared to 35kb for the western Atlantic chart, for example.)
UK MET Office: The UK has charts for the eastern Atlantic.
The UK charts listed on the NWS International Charts index can be downloaded using Saildocs. For example:
send PPVA89.TIF
Bermuda Weather Service: Local charts focused on Bermuda
send PPVA89.TIF
Bermuda Weather Service: Local charts focused on Bermuda
Bermuda charts can be downloaded using the Saildocs feature that allows full webpage downloads. For example, the current Bermuda chart:
send http://www.weather.bm/images/surfaceAnalysis/Latest/Local.png
Two, three, and four day forecasts:
send http://www.weather.bm/images/marineChart/Latest/Small/_chartSmall36.gif
send http://www.weather.bm/images/marineChart/Latest/Small/_chartSmall60.gif
send http://www.weather.bm/images/marineChart/Latest/Small/_chartSmall84.gif
TEXT FORECASTS
High Seas text forecasts work hand in hand with weather charts. They are the explanation of the weather features displayed on the charts, and provide additional information not provided on the charts. You need both charts and text forecasts to get the complete picture.
Webpages
- MetArea IV - from the NWS
- MetArea II - from METEO-FRANCE
Voice
To obtain text forecasts by email, send an email like this:
To: query@saildocs.com
Subj: any
Body:
send Met.2
- or -
sub Met.4 time=06:00 days=5
The Meteo-France reports use name for forecast areas, so you need the following chart to understand them.
SHIP REPORTS
Ship reports are part of the raw data used to create weather charts. But weather charts only display a small selection of all the ship reports that are available. Ship reports let you know what weather all the ships around you are experiencing in near real time.
Webpages
Starpath provides a very convenient service: give them a location and they will provide all ship reports within 300 miles. A great way to get near realtime data for the water around you.
Email
To obtain spot ship reports by email, send an email like this:
To: shipreports@starpath.com
Subj: 38.2N, 70.3W
Body: blank
Specify the spot location in decimal degrees, as shown above. The email response will include a list of reports that you can plot manually, and also a GPX file that enables you to import the reports into a navigation program like Aqua Map. I will write a separate blog post on this topic, as it is a bit involved.
GRIB DATA
GRIB data is raw model data that has not been processed by human meteorologists. To be used only in conjunction with expert analysis and forecasts.
Webpages
Email
The simplest way to get wind, waves, and pressure in one GRIB file is to use Saildocs. LuckGrib also allows you to download wind and waves, but you must create two different requests, and then combine the two files (or view them separately.)
To obtain GRIB reports by email, send an email like this:
To: query@saildocs.com
Subj: any
Body:
send gfs:41N,35N,79W,56W|0.5,0.5|0,6,...,36,48,...,96|Wind,PRESS,WAVES
-- or --
sub gfs:36N,42N,70W,76W|0.5,0.5|0,6,...,36,48,...,96|Wind,PRESS,WAVES time=06:00 days=5
Note: don't allow your computer's spell checker to convert the three periods '...' into an ellipse '…', which is a single character that looks like three periods. They look the same, but are not the same and the ellipse will cause the request to fail.
- MetArea IV - broadcast by USCG on SSB
- MetArea II - I haven't been able to locate information on this yet.
To obtain text forecasts by email, send an email like this:
To: query@saildocs.com
Subj: any
Body:
send Met.2
- or -
sub Met.4 time=06:00 days=5
The Meteo-France reports use name for forecast areas, so you need the following chart to understand them.
 |
| Forecast locations in Metarea II |
SHIP REPORTS
Ship reports are part of the raw data used to create weather charts. But weather charts only display a small selection of all the ship reports that are available. Ship reports let you know what weather all the ships around you are experiencing in near real time.
Webpages
Starpath provides a very convenient service: give them a location and they will provide all ship reports within 300 miles. A great way to get near realtime data for the water around you.
To obtain spot ship reports by email, send an email like this:
To: shipreports@starpath.com
Subj: 38.2N, 70.3W
Body: blank
Specify the spot location in decimal degrees, as shown above. The email response will include a list of reports that you can plot manually, and also a GPX file that enables you to import the reports into a navigation program like Aqua Map. I will write a separate blog post on this topic, as it is a bit involved.
GRIB DATA
GRIB data is raw model data that has not been processed by human meteorologists. To be used only in conjunction with expert analysis and forecasts.
Webpages
The simplest way to get wind, waves, and pressure in one GRIB file is to use Saildocs. LuckGrib also allows you to download wind and waves, but you must create two different requests, and then combine the two files (or view them separately.)
To obtain GRIB reports by email, send an email like this:
To: query@saildocs.com
Subj: any
Body:
send gfs:41N,35N,79W,56W|0.5,0.5|0,6,...,36,48,...,96|Wind,PRESS,WAVES
-- or --
sub gfs:36N,42N,70W,76W|0.5,0.5|0,6,...,36,48,...,96|Wind,PRESS,WAVES time=06:00 days=5
Note: don't allow your computer's spell checker to convert the three periods '...' into an ellipse '…', which is a single character that looks like three periods. They look the same, but are not the same and the ellipse will cause the request to fail.
Next time, I will note how to combine and subscribe to most of these requests so the data is ready for download when we need it.
NAVTEX
(Actually, I'm not sure if you can count NAVTEX as high seas forecasts... More like offshore forecasts. I may move this section to a new page on offshore weather...)
Websites
NAVTEX (NAVigational TEleX), is an international system for receiving navigational warnings, weather warnings and forecasts, and urgent safety information, pithing 200 nm from shore. It is not commonly used in the States, which depends on USCG VHF broadcasts and NOAA Weather Radio for similar purposes, but is very common in Europe.
(Actually, I'm not sure if you can count NAVTEX as high seas forecasts... More like offshore forecasts. I may move this section to a new page on offshore weather...)
Websites
- GMDSS site for MetArea II - includes link to current NAVTEX forecast
- Coruna forecast - example forecast
- Furuno receiver
- Furuno receiver with printer
- NASA marine receiver with bluetooth - very reasonable! Uses iPad for display.
 |
| NASA Marine receiver only. Uses iPad for display. Looks easier to use than the LCD models. |
Next Up: Let the Preparations Begin
No comments:
Post a Comment
I'd love to hear from you. Please comment!