So, the first problem we need to look at is, how to load a weather chart (that we've downloaded via email or weather fax) into qtVlm. To do this, we need to tell qtVlm what part of the planet the chart covers. This process is called georeferencing. Most charting programs can't do this, and that's what makes qtVlm useful for this job.
We need to make a couple of assumptions to keep the length of this post somewhat reasonable:
- I will be using an iPad for my examples, but the techniques are nearly the same on a Mac and quite similar on PC or other tablet, but I won't be discussing those variations here.
- I will be using email for downloading weather charts and GRIB data. There are other ways to obtain exactly the same data at sea, but those methods are out of the scope of this discussion.
Step 1 - Save weather chart to Photos
After we've downloaded the weather charts using email, we need to save them to the Photos app for two reasons:
- some of the charts need to be rotated into the north-up position before they can be used
- qtVlm can access the charts once they are in Photos
Any email program on the iPad can save an image into Photos using the share button. In the normal iPad Mail app, there is the share button at the top of the screen. In the Iridium Mail app, there is a text button at the bottom of the screen.
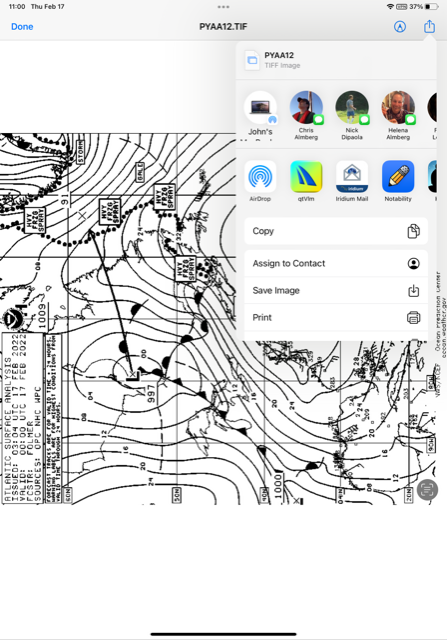
Share button on iOS Mail app
Select 'Save Image'
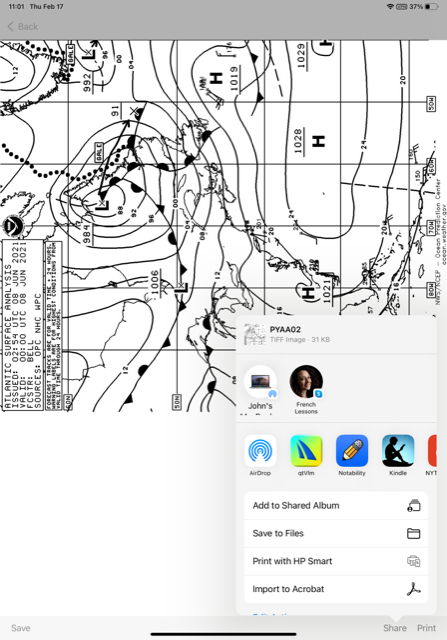
Share button on Iridium Mail app
Select 'Add to Shared Album'
Once the chart is in Photos, you can rotate it if necessary to orient it so that it is north-up. For example, the chart in the image above is east-up, and will need to be rotated.
Note: for some reason, the Iridium Mail app can only save an image to a Shared Album in Photos. Unfortunately, you can't rotate an image that is just in a shared album. So you need to add the following steps:
- Go to the shared album you've saved the chart to (I use one I created called Weather Charts)
- Open the image
- Click the share button, and choose 'Save Image'
This will save the image to the normal Photos library.
Step 2 - Rotate if necessary
If a chart is not oriented north-up, you need to open the image in Photos and use the Edit tool to rotate it into the correct orientation:
- open the image in Photos
- click the Edit button in the upper right-hand corner
- click the crop and rotate button on the left side
- click the rotate button at the top of the screen enough times that the image is north-up
For example, here is the Western Atlantic Surface Analysis chart after being rotated into the north-up orientation in Photos.
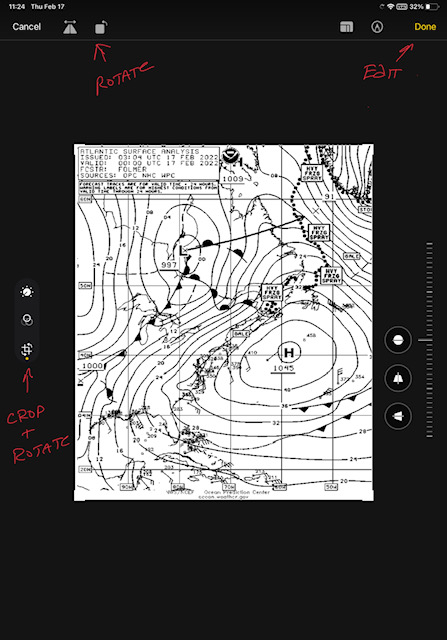
The Edit screen in Photos
(after clicking the Edit button in the upper-right corner.)
Step 3 - Load a chart into qtVlm
For this discussion, let's assume we are working on the Western Atlantic Surface Analysis chart, PYAA12.TIF. We assume the chart image has been downloaded, saved to Photos, and rotated into the north-up orientation.
The steps to load the chart into qtVlm are:
- Open qtVlm on your iPad
- Click the menu button in the lower-right corner of the app
- Choose the Grib menu option
- Choose the Weather images option
- Choose the Open a weather image option
- Choose the Weather image configuration 1 tab on the pop-up window
- Click the Gallery button and a list of photos will be displayed
- Choose the correctly rotated PYAA12.TIF image
qtVlm can hold up to 8 different weather charts. You want to be consistent in which chart goes into which configuration. For example, for an Atlantic crossing, it makes sense to always put PYAA12.TIF into Configuration 1. If you do so, you will only need to go through the following Georeferencing steps once for each chart.
Step 4 - Georeference the chart
The chart image is now loaded into qtVlm, but the program has no idea how big the chart is, or where to place it on the globe. We need to tell it two things:
- The latitude and longitude of the chart's upper-left corner
- How 'big' the chart is, in terms of degrees of latitude and longitude
However, if you click the chart below to view it full size, you can only estimate the latitude and longitude of the upper-left corner of the chart. It is roughly 65°N, 100°W, but that is good enough to get us going.
Similarly, we can only estimate the width of the chart in degrees longitude, and the height of the chart in degrees latitude. Roughly, they are Longitude: 57°, Latitude: 50°.
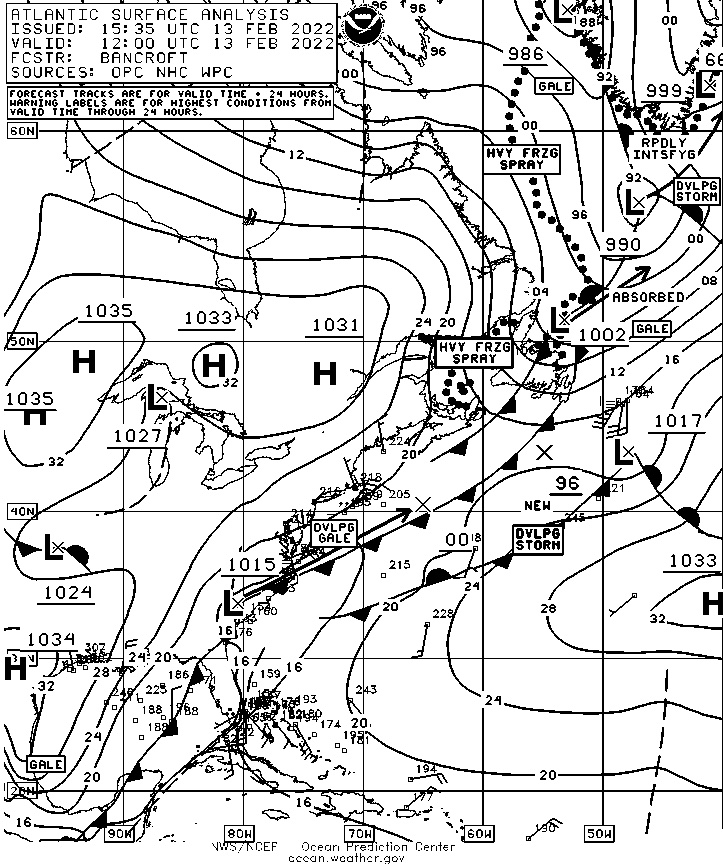
Chart PYAA12.TIF
The steps to georeference a chart in qtVlm are:
- Estimate the latitude and longitude of the upper-left corner of the chart
- Enter these numbers in the Left Corner Position of the Weather Image Configuration tab. Be sure to choose the North and West options
- Estimate the width of the chart in degrees of longitude
- Estimate the height of the chart in degrees of latitude
- Enter these number in the Longitude and Latitude Range fields.
- Click the Activate button in the upper-left corner of the configuration tab
- Set the Transparency slider to about mid position.
- Click the OK button at the bottom of the configuration pop up window. You may need to scroll down to see it.
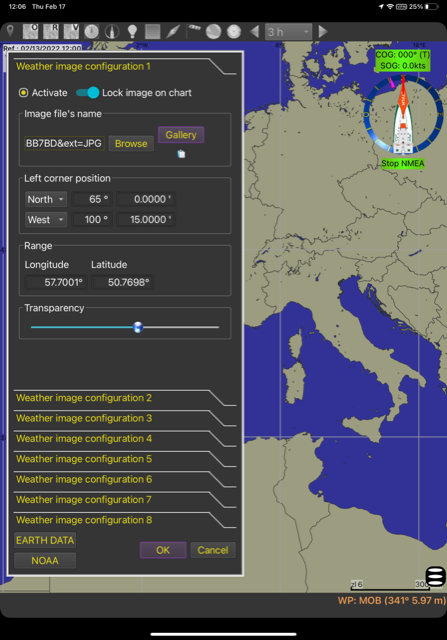
Georeferencing the chart using the
Weather image configuration tab
After clicking the OK button to activate the weather chart, you should see the chart displayed in qtVlm in roughly the correct position. If not, you have made a mistake, most likely you have forgotten to click the 'West' button in setting the Left Corner Position. At least, that's the mistake I make most often!
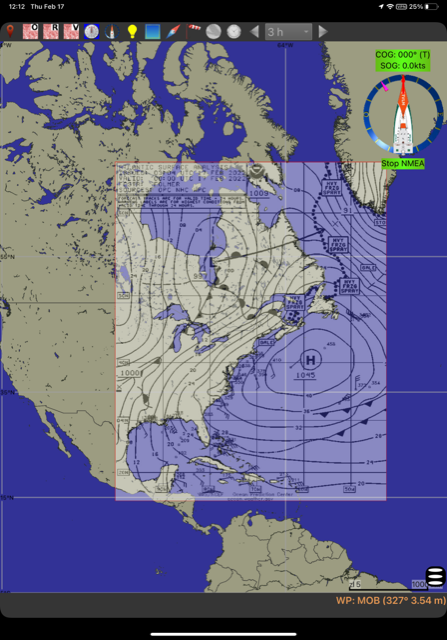
Georeferenced chart in position
Note that the transparency setting on the image allow you to see the base chart underneath the weather chart. Probably your chart isn't lined up perfectly. You will need to tweak the Left Corner position and Range values until the weather charts lines up perfectly (more or less!) with the base chart.
The steps for tweaking the geo-positioning values are:
- Using the north-most and west-west most latitude and longitude lines on the weather chart, tweak the Left corner position values until the lines on the weather chart line up with the lines on the base chart. You will have to move the image on the screen until these lines line up roughly, then tweak the values.
- Do the same thing with the lower-right corner of the chart, using the Range values
- Repeat until the chart is 'good enough'.
This is a tricky process the first time, but once you get the hang of it, it goes fast.
Here is what I mean by lining up the latitude and longitude lines of the chart and base map. You will have to move the chart around on the screen until the lines roughly line up. For example, here I have lined up the 60N and 80W lines. If you view the image below full screen, you can just about see the number on the base chart at the top and left sides of the chart.
Note that the image below shows the lines after the Left corner position has been tweaked into position. Before tweeking, the lines do not line up perfectly.
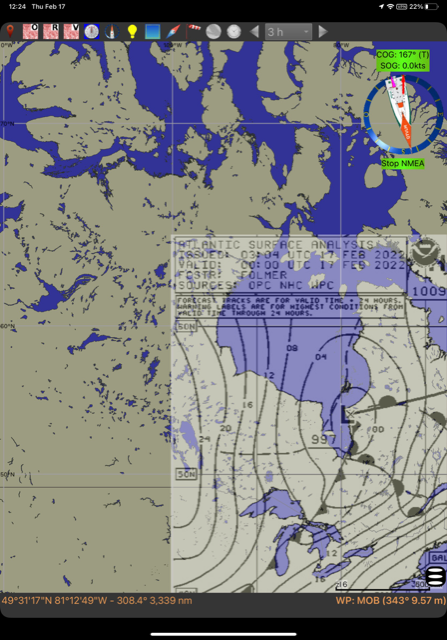
Using the latitude and longitude lines on
both charts to zero in on the Left corner position
If you are still with me, and have followed along, you no doubt are saying, "Well that was a pain!"
The good news is that you only need to do this once for each different chart. The next time you load the same chart into the same configuration tab, it can use the same georeferencing values.
I will list the geo-referencing values that work for me on my iPad below. You would think the same values would work on every copy of qtVlm, but I found that the values needed for my iPad were not the same as those needed for qtVlm on my MacBook. I have no idea why this is, but intend to query the developers on this. They should be the same, I think!
Anyway, I have to assume that you will have to also tweak the georeferencing values for your machine, so I have given you the full process. It may be that the values I used on my iPad will work perfectly on your iPad, so I will list them below. They will at least get you close.
Western Atlantic Surface Analysis - PYAA12.TIF
Left corner position:
65° 0.0'N 100° 15.0'W
Range:
57.7° Long
50.77° Lat
Easter Atlantic Surface Analysis - PYAA11.TIF
Left corner position:
65° 4.0'N 50° 20.0'W
Range:
58.0° Long
50.91° Lat
24-Hour Surface Forecast - PPAE00.TIF
Left corner position:
51° 0.0'N 99° 55.0'W
Range:
61.9° Long
31.5° Lat
48-Hour Surface Forecast - QDTM85.TIF
Left corner position:
64° 0.0'N 98° 24.0'W
Range:
109.72° Long
50.33° Lat
Okay! That's enough for today. Congrats if you have followed along up to here. This is advanced weather stuff! Next time we will overlay GRIB data onto these weather charts.
No comments:
Post a Comment
I'd love to hear from you. Please comment!