Last time I promised to blog about something I've wanted to do for a long time, which is to display pilot charts in an iPad charting app, like qtVlm. My primary reason for writing this blog is to make sure I don't forget how to do something after I've taken a long time to figure it out. Alas, I waited too long to write this post! I've actually forgotten how I did it, so will have to figure it out again, this time writing down the procedure as I go.
So, let's go.

Pilot charts are used as passage planning tools. Much of the information contained on pilot charts stems from the shipmasters’ log-books kept by the 19th century Lieutenant Matthew Fontaine Maury of the US Navy. He earned the title of the ‘Pathfinder of the Seas’ for his study of ship routes and logbooks.
LOADING SET OF PILOT CHARTS INTO QTVLM
As we saw last time, it's relatively easy to plonk an image into qtVlm and georeference it. This is what I did with my first attempt to solve this problem: just grab the PDFs of the pilot charts that anyone can download from National Geospatial-Intelligence Agency. Alas, these downloadable PDFs are not high-resolution enough. They load fine, but the low resolution makes them look very fuzzy on the screen. This stumped me for quite a while, until I discovered a trove of high-resolution pilot charts created by the OpenCPN team. These are not just PDF files, but real electronic charts in BSB ver2 raster chart format. You can see the complete list of pilot charts on the OpenCPN website.
If you click on the link for the Central North Atlantic charts, you will download a file called NAC.7z. Yeah, I was scratching my head too. What is a 7z file? The 'z' should have been a tip-off. It's a type of zip file. In other words, a set of files that have been bundled together and compressed to minimize size.
I assumed the set of files was the set of pilot charts, one for each month of the year. But how to download and extract them on an iPad? Not so easy.
The first thing you need is an iPad app that can unzip 7z files. There are several, but I used iZip. So if you want to follow along, go to the App Store and install the iZip app.
Once you've done this, downloading the 7z file *is* fairly easy. Just use Safari on your iPad to go to this OpenCPN web page, scroll down a bit, and click on the part of the world you are interested in, like the Central North Atlantic. You will get a pop-up asking "Do you want to download "NAC.7z"? Just click the 'Download' button and the download will commence.
When the download is complete, click on the 'show downloads' button in the Safari tool bar. It should be just to the right of the address bar, unless you've rearranged things. It looks like a down-arrow inside a circle.

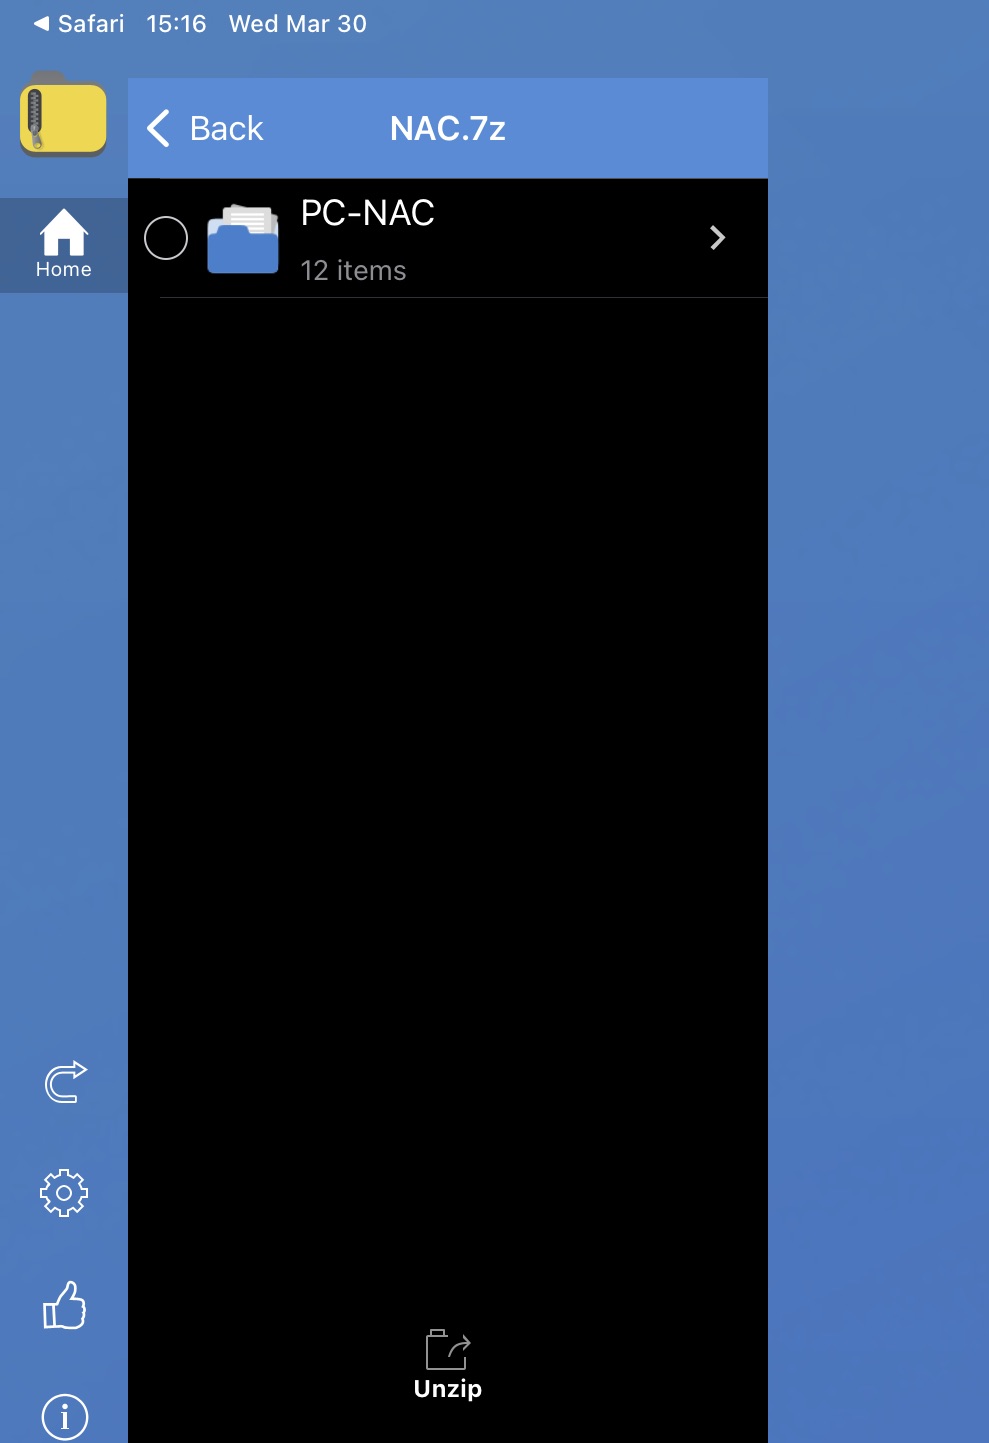
The file you've just downloaded should be in the dropdown. In my case NAC (for North Atlantic Central.) Click on this filename, and the iZip app should open up automatically. If not, just select it from the list of apps that can handle 7z files (you have more than one???) It will ask "Would you like to unzip all files?" Click the OK button.
The unzip process should only take a few seconds on a modern iPad. When it finishes, click on the "Back" button.

- Open qtVlm
- Click on the Menu icon, in the bottom-right corner of the screen - this will open the menu
- Click on "View" menu option
- Click on "Single chart"
- Click on "Open a chart" - this will open the Chart window.
- Click on the "Browse" button - this will display a list of folders
- Click on the "kaps" folder (where all .kap files are stored, like the one's we just installed)
- Click on the pilot chart you wish to view, for example the June pilot chart - NAC06.kap
- Click the OK button at the bottom of the screen (you might need to scroll down)
- Click the OK button at the bottom of the Chart window.
To display the July chart, just go back to the Menu and follow the procedure above to load NAC07.kap. Once you get the hang of it, it only takes a few seconds to switch charts.
In the image below, I've zoomed the chart display out far enough to display the whole pilot chart. You can see that it is geo-referenced perfectly. That is, it is displayed in the correct location in the chart display. Of course, in real life, we would be zoomed in on a certain area of the chart, like in the next image.

You can even use a pilot chart as a base map, displaying GRIB data and weather charts over it.
For example, here is the June NAC chart with GRIB data showing the Gulf Stream layered over it.

Using a pilot chart as a base map, with GRIB data layered over it.
I think this is an amazing tool for both planning passages, both before and during the passage. Let me know what you think in the comments below!
No comments:
Post a Comment
I'd love to hear from you. Please comment!