At this point in our sailing career, Helena and I have accumulated quite a few offshore miles on Petronella, including two week-long passages up the east coast of the US. Anyone who does this much sailing is likely to take a passionate interest in the weather, and I'm no exception. It helps me anticipate how much wind we are going to have (typically, not enough!), where it will be coming from (typically, on the nose, or dead aft!), what's the best course to steer for where we are going (weather routing), and very occasionally, when to get ready for nasty weather.
Many people these days depend on GRIB data as their primary or even sole source of weather information. It's easy to get, easy to interpret, and seemingly precise. For local sailing, I do the same thing. For example, when we are in Maine, I love to download the HRRR model data using my favorite weather app, LuckGrib, because it tells me if there is going to be fog that day, and where it will be. It's not perfect at this, but it's darn good.
On long offshore passages, I want more information. In particular, I want good, old-fashioned weather charts. We used to get these via weather fax, but these days it's much easier to get them via email using our Iridium Go. Weather charts give you the 'big picture': the highs, lows and fronts that are the stars in the majestic ballet of large scale weather systems. While it's possible to look at GRIB data displays and guess where these are, as an amateur, I would prefer to have this kind of analysis done by actual weather scientists. This is what the guys and gals at NOAA do every day, and one of their primary work products are these weather charts which are updated and published 4 times a day. It's just silly, in my opinion, to ignore these amazing weather products while at sea.
Once you have both weather charts and GRIB data in hand, it's fairly easy to compare them side by side, but I've long wanted to somehow overlay the GRIB data onto the weather charts. This has been possible to do for a long time with the desktop navigation program called OpenCPN, but I don't like using my MacBook Pro at sea. I don't have a good place to use it, really, and I'm always afraid it is going to fly across the cabin and splinter into a thousand pieces. I prefer to use my iPad. If it's rough, I can curl up in a bunk with a lee cloth and do my navigation and weather forecasting in comfort and safety. But until recently, I didn't know of any app that could layer weather charts and GRIB data on the same screen.
Enter qtVlm. This is an amazing navigation program that seemingly aims to do it all. It is loaded with features, but I'm just going to focus on one of these: the ability to display weather charts and GRIB data simultaneously. Spoiler alert: the result is just as great as I always hoped it would be.
First, what data do you need, and how can you get it? The basics are:
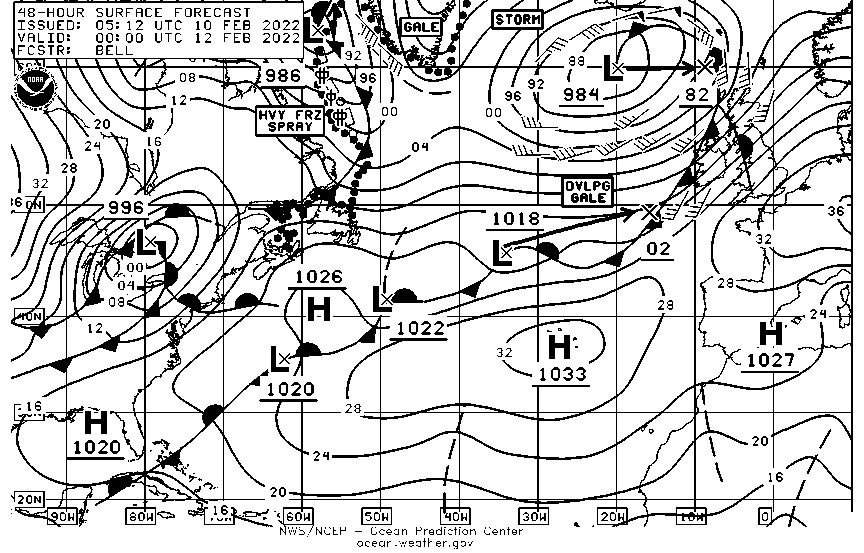
- Weather analysis chart showing the current weather, plus forecast charts for 24, 48, and possibly 72 and 96 hours in the future. In practice, I tend to use just the 24 and 48 hour forecasts unless I am worried a special weather event is on its way.
- The high-seas text forecast which is basically a explanation of the weather charts written by the forecasters who create them
- GRIB data for the area to be sailed in the next week or so.
send PYAA11.TIFsend PYAA12.TIF
send https://ocean.weather.gov/shtml/A_sfc_full_ocean.gif
send PPAE00.TIF
send QDTM85.TIF
send PPAK98.TIF
send PWAM99.TIF
send met.4
send met.2GFS:43.00N,35.00N,78.00W>25.00W|1.0,1.0|0,6,12..168|WIND,PRMSL,HTSGW
- PYAA11.TIF, the latest weather analysis chart for the eastern Atlantic
- PYAA12.TIF, the latest weather analysis chart for the western Atlantic
- A_sfc_full_ocean.gif, the latest weather analysis chart for the whole Atlantic
- PPAE00.TIF, the 24 hour forecast chart for the whole Atlantic
- QDTM85.TIF, the 48 hour forecast chart for the whole Atlantic
- PPAK98.TIF, the 72 hour forecast chart for the whole Atlantic
- PWAM99.TIF, the 96 hour forecast chart for the whole Atlantic
- met.4, the latest weather discussion for Metarea 4, which covers the western Atlantic
- met.2, the latest weather discussion for Metarea 2, which covers the eastern Atlantic
- GRIB data for area likely to be sailed on a passage from the Chesapeake to the Azores
No comments:
Post a Comment
I'd love to hear from you. Please comment!